LOADING PORTFOLIO
About Journey Projects What I bring Freelance Blog Contact
Analytical Detail-oriented Self-taught Team leader Curious Builder
KATHMANDU, BAGMATI, NEPAL — OPEN TO INTERNSHIPS

Data, Applied
Differently.

I'm Sandip Subedi, an aspiring data analyst who turns raw, messy tables into clear findings — with Python, Pandas, and a habit of questioning the first answer a dataset gives me.

0
Self-built
data projects
0
DATA records
analyzed
0
Years Design
Learning
Sandip Subedi
4 Projectsshipped solo
SANDIPsandipsubedi0
Python PandasNumPy MatplotlibSeaborn scikit-learnEDA Data CleaningDashboarding Survey DesignJupyter Google Colab Python PandasNumPy MatplotlibSeaborn scikit-learnEDA Data CleaningDashboarding Survey DesignJupyter Google Colab
About me
CURRENTLY

Data Analysis,
AI/ML Trainee

Budhanilkantha,Bhangal-02 · Nepal
Jun 2026 — Present

PythonDataAnalysisMachineLearningGraphicDesign

Aspiring data analyst with a self-built portfolio of Python projects spanning exploratory data analysis, data cleaning, and visualization. Combines analytical skills with real experience in event leadership, project management, and graphic design.

Completed +2 Science with a Computer Science focus, and is now seeking a Data Analyst internship to apply and grow these skills in a real team setting — while independently building a personal AI assistant, NepJARVIS, on the side.

My journey, so far.

Not a straight line — a school in Kathmandu, a club nobody had run in five years, and a growing stack of Jupyter notebooks.

'17
@education

Where it started

Began Secondary Education (SEE) at Shree Jana Uddhar Secondary School — seven years that built the foundation for everything after.

'22
@leadership

Taking the lead

Started planning a school-wide science and technology carnival — the first in five years — with a 3-student core team. It would go on to draw 19–21 participating schools. Coordinated logistics, project development, and event execution, and partnered with Karkhana on technical components.

'24
@present

President, and a new chapter

Re-established the STEAM Club after the carnival and was appointed President. Started +2 Science (Computer Science focus) at Valley Public High School, and began freelancing in graphic design and WordPress development alongside coursework.

'25
@data

Learning to read data properly

Built out a run of independent analytics notebooks — Titanic survival patterns, HR attrition by department, and 14 years of BMW global sales data (~50,000 records) — each one taken from raw file to finished dashboard.

'26
@now

Still obsessed, still building

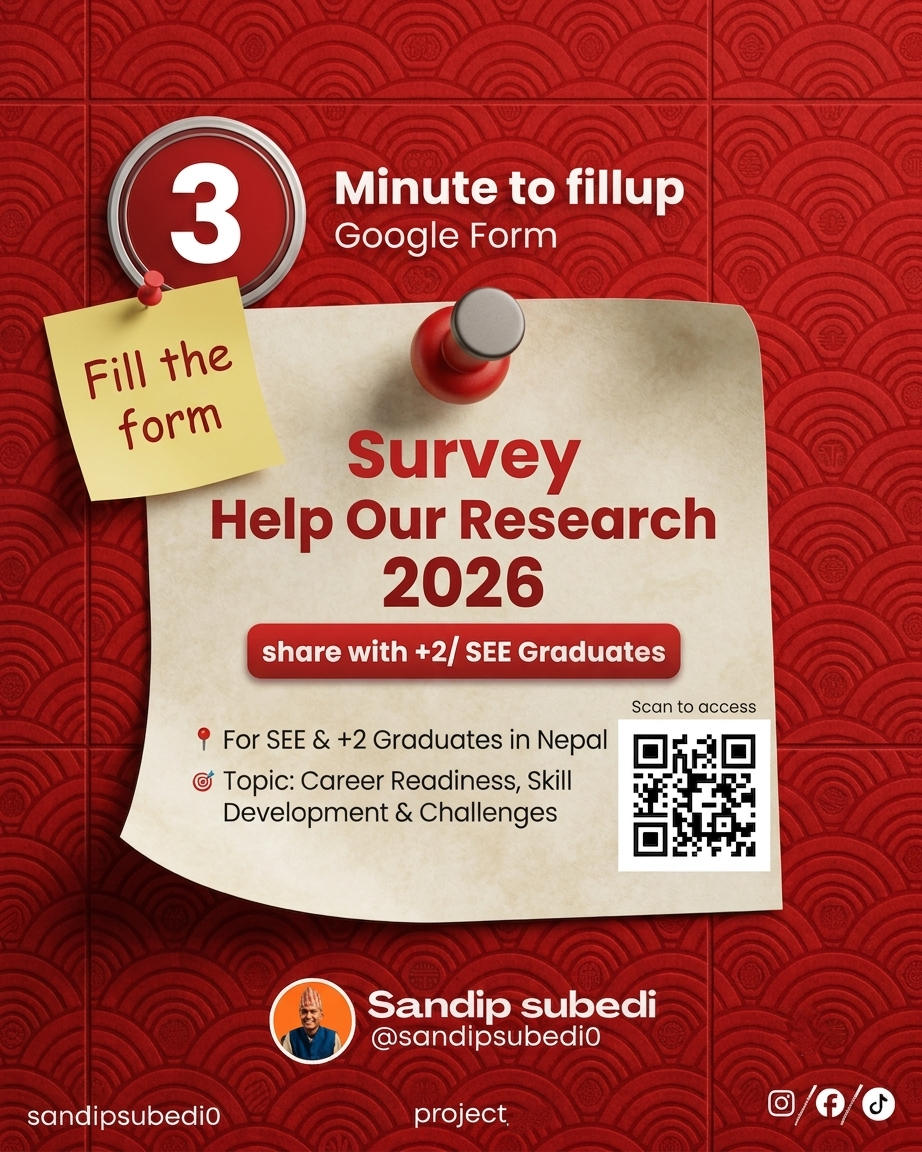
Currently designing an original survey on student career readiness in Nepal — scope to predictive model — and building a personal AI assistant, NepJARVIS. Looking for a Data Analyst internship to do this inside a real team.

Selected projects.

Four notebooks, four different problems — raw data taken all the way to a finished, readable story.

IN PROGRESS survey · Kathmandu 42% SCOPING
01 / @data

Student Career Readiness in Nepal

An original survey — not a Kaggle dataset — collecting anonymous responses from students across Kathmandu, studying whether Nepali students are building the skills and professional presence today's job market demands. Full pipeline planned: scope, exploration, cleaning, visualization, findings, and a predictive Career Readiness Score model, with RAG-based exploration also planned.

PythonPandasNumPySurvey Design
COMPLETE 2010 – 2024 · ~50,000 records 2010 2024
02 / @data

BMW Global Sales Analysis

Analyzed 14 years of BMW sales data (~50,000 records) across models, regions, pricing, and fuel types — producing a correlation heatmap, 12 distribution charts, and a final dashboard.

PythonPandasMatplotlibSeaborn
COMPLETE 1,470 employee records Attrition % by department size SalesR&DHR MktgTechOps
03 / @data

HR Employee Attrition Analysis

Cleaned and analyzed 1,470 employee records, recalculating attrition by department size rather than raw counts — correcting a misleading initial finding.

PythonPandasMatplotlibSeaborn
COMPLETE 5 phases · 7 visualizations Survival: 1st/Female vs 3rd/Male 97% 14%
04 / @data

Titanic Survival Analysis

Built a 5-phase notebook with 7 visualizations showing gender and ticket class as the strongest predictors of survival — 97% vs. 14% across groups.

PythonPandasMatplotlibSeaborn

What I bring.

Capabilities built through independent projects and real leadership, not just coursework.

Data cleaning work sample
EDA notebook sample
Data cleaning work sample
01

Data Cleaning & EDA

Imputation, correlation and distribution analysis — finding what a dataset actually says before charting it.

Dashboard sample
Chart visualization sample
Dashboard sample
02

Visualization & Dashboards

Matplotlib and Seaborn, from single charts to full dashboards people can actually read at a glance.

Modeling notebook sample
Career readiness score model sample
Modeling work sample
03

Modeling, early stage

scikit-learn and sentence-transformers, currently applied to a predictive Career Readiness Score.

Survey design sample
Research question design sample
Survey design sample
04

Survey & Research Design

Built an original student survey from scratch — question design, anonymity, and scope, not a downloaded dataset.

Team leadership sample
Carnival event sample
Leadership sample
05

Project & Event Leadership

Led a 3-student team through a school carnival that drew 19–21 schools — logistics, mentorship, and delivery.

Design work sample
Brand and layout sample
Design work sample
06

Communication & Design

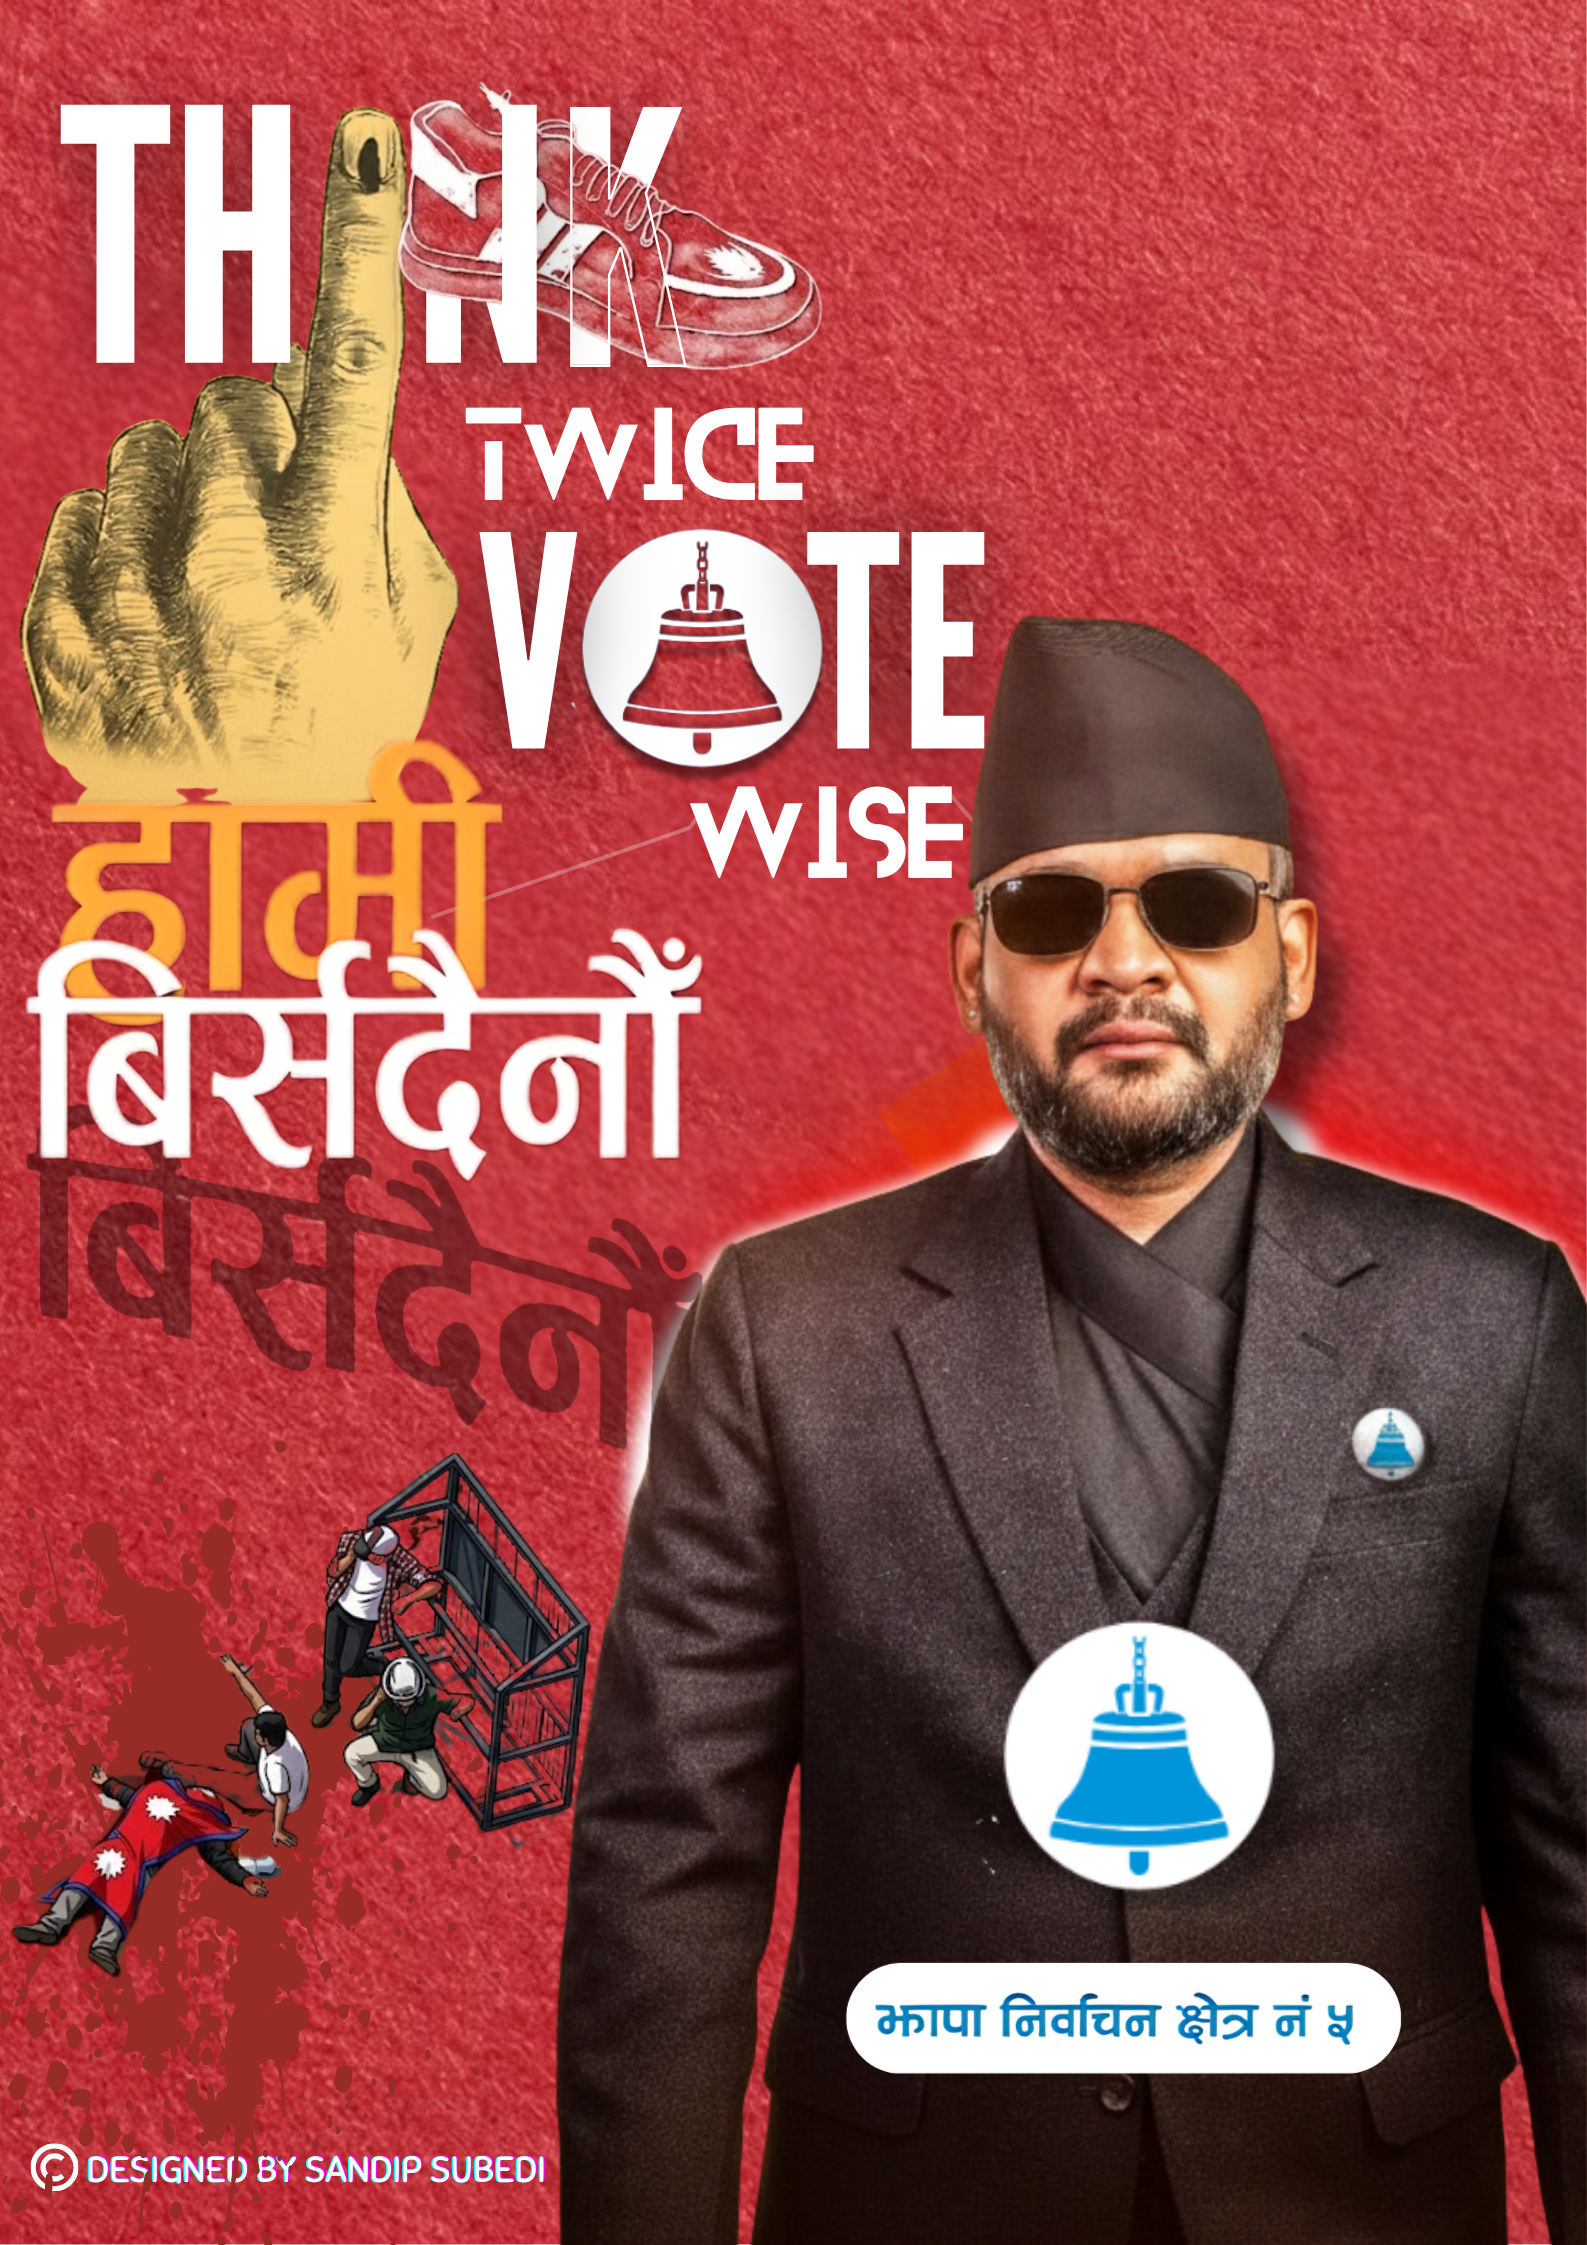
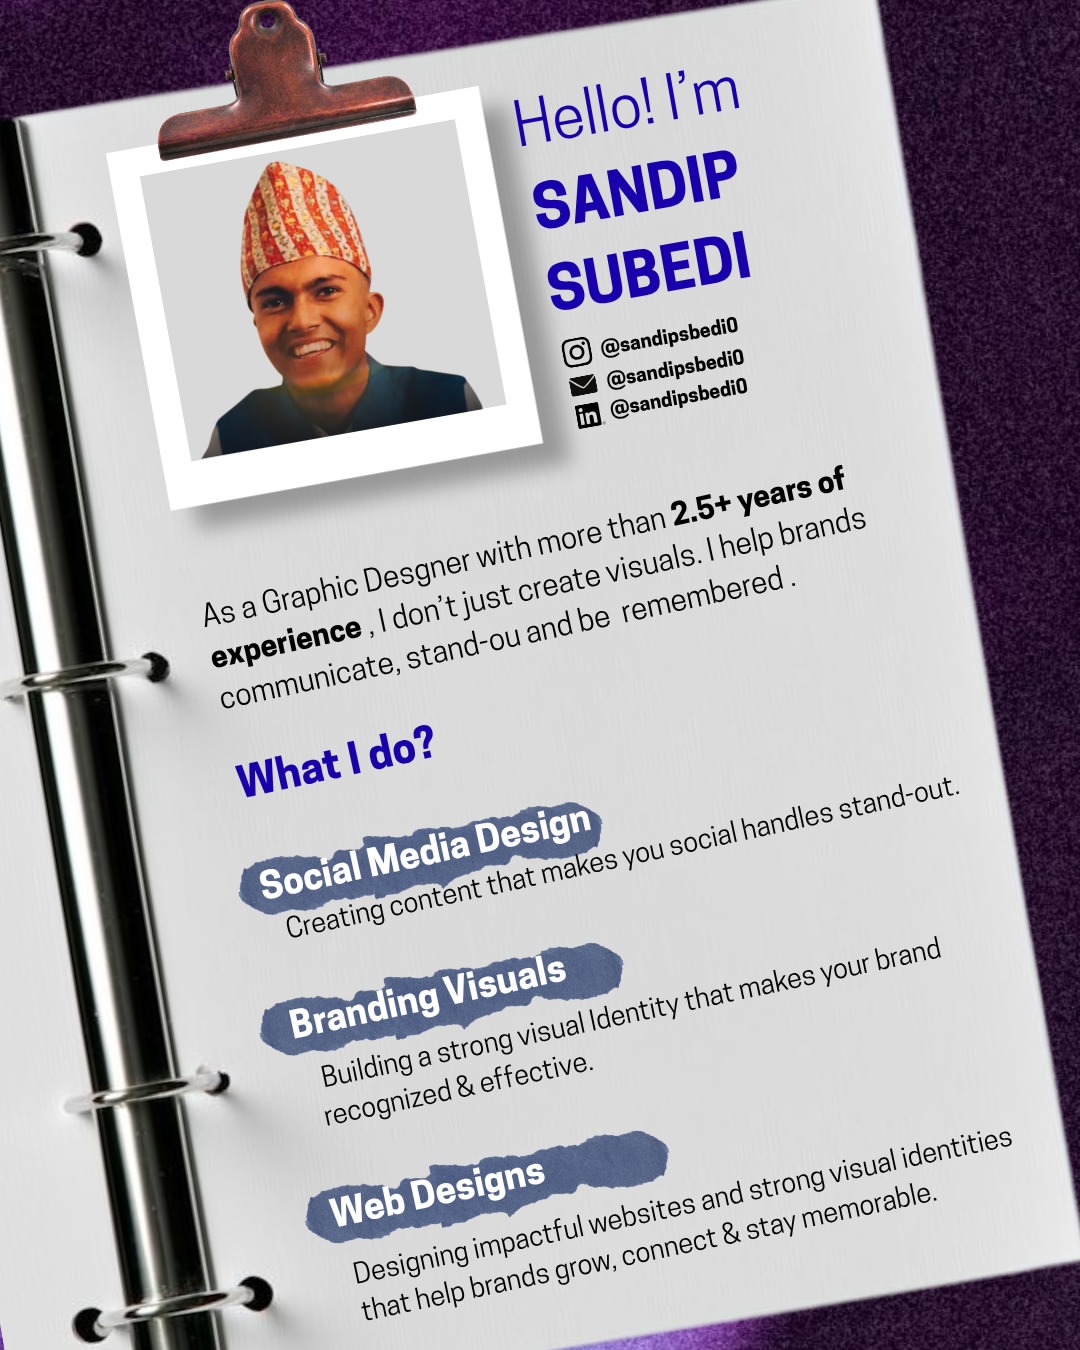
2.5+ years freelancing in Canva and Photoshop — making findings and brands look like they belong in front of people.

Outside the notebook.

Freelance work that runs alongside the data projects.

SINCE 2023

Freelance Graphic Designer

2.5+ years

Promotional posters, brand assets, and social media creatives for local businesses, using Canva and Adobe Photoshop.

ONGOING

Freelance WordPress Developer

Client sites built & maintained

Building and maintaining WordPress websites for clients, end to end.

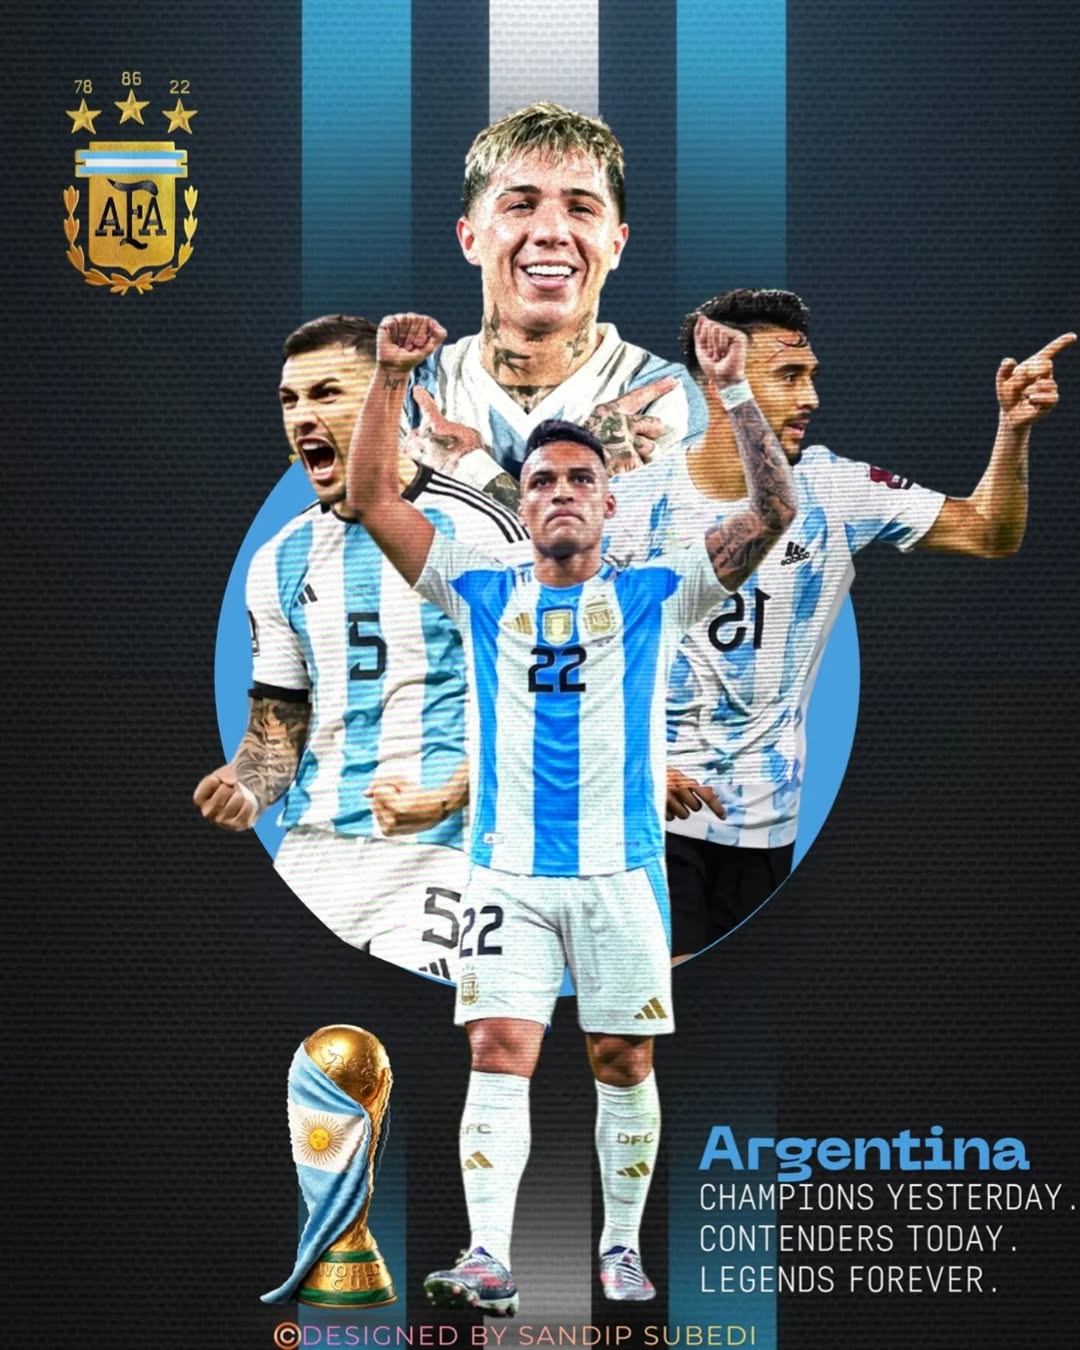
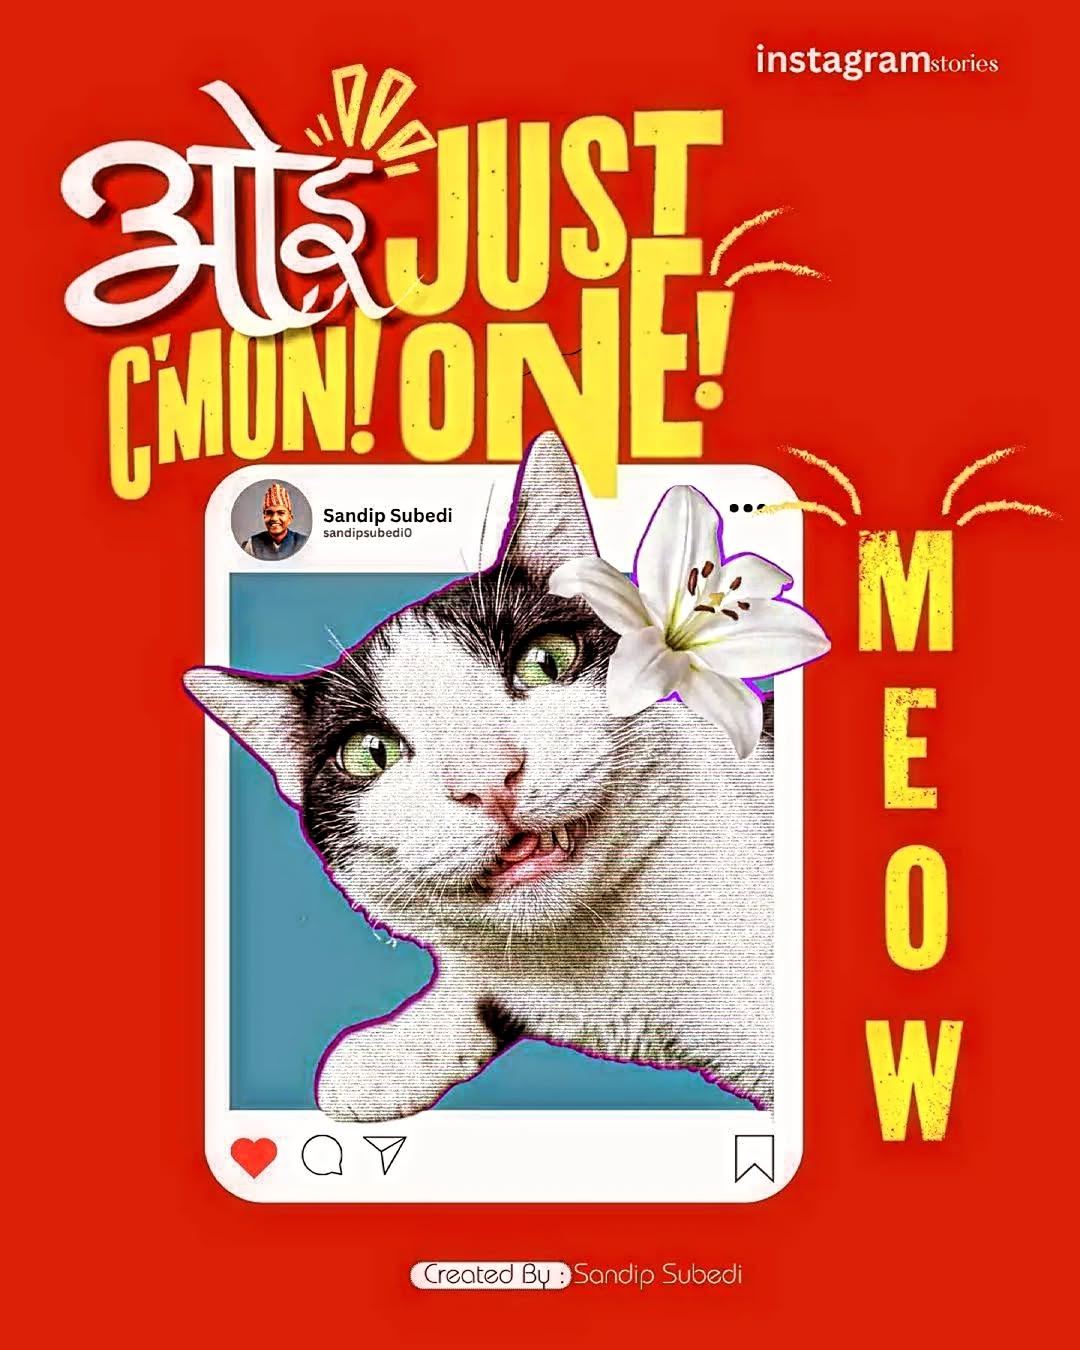
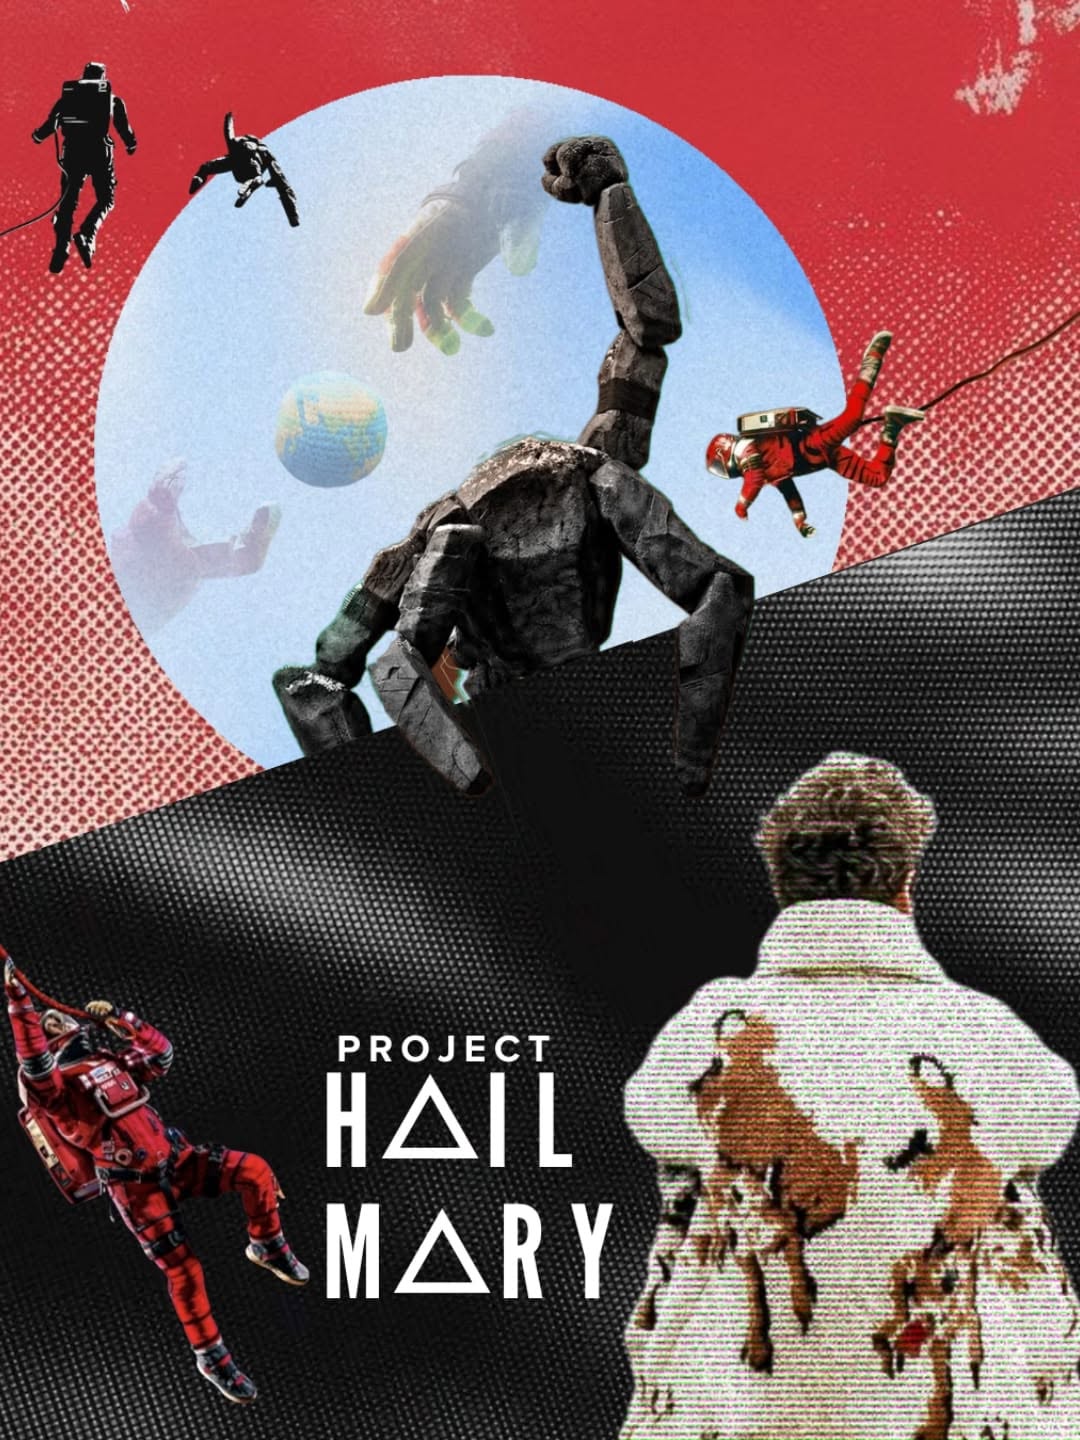
Graphic design.

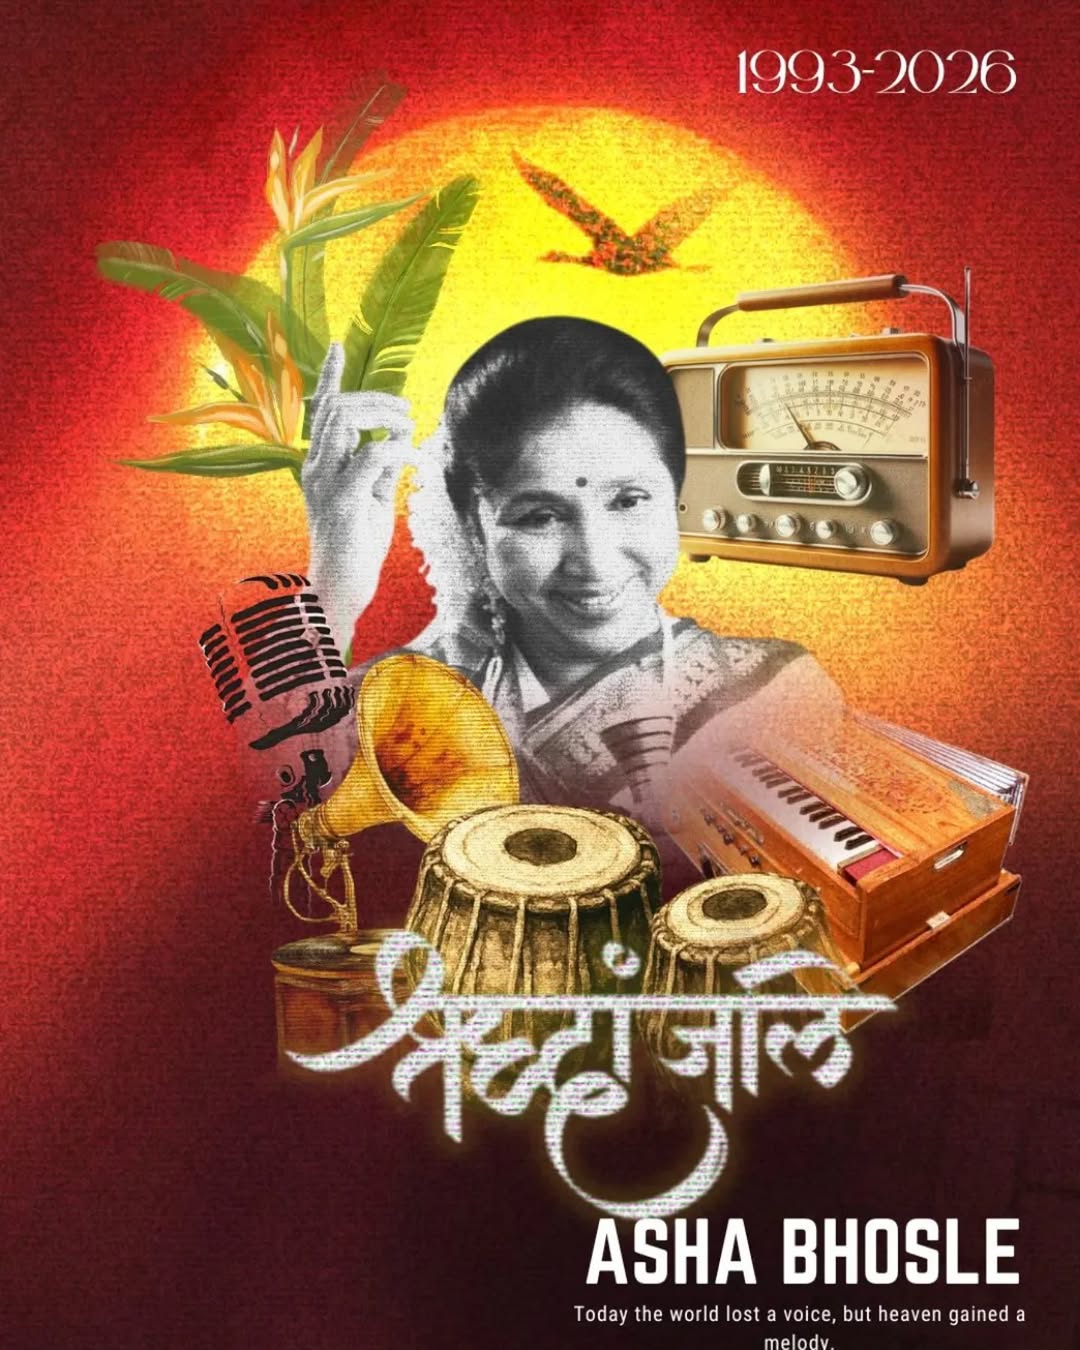
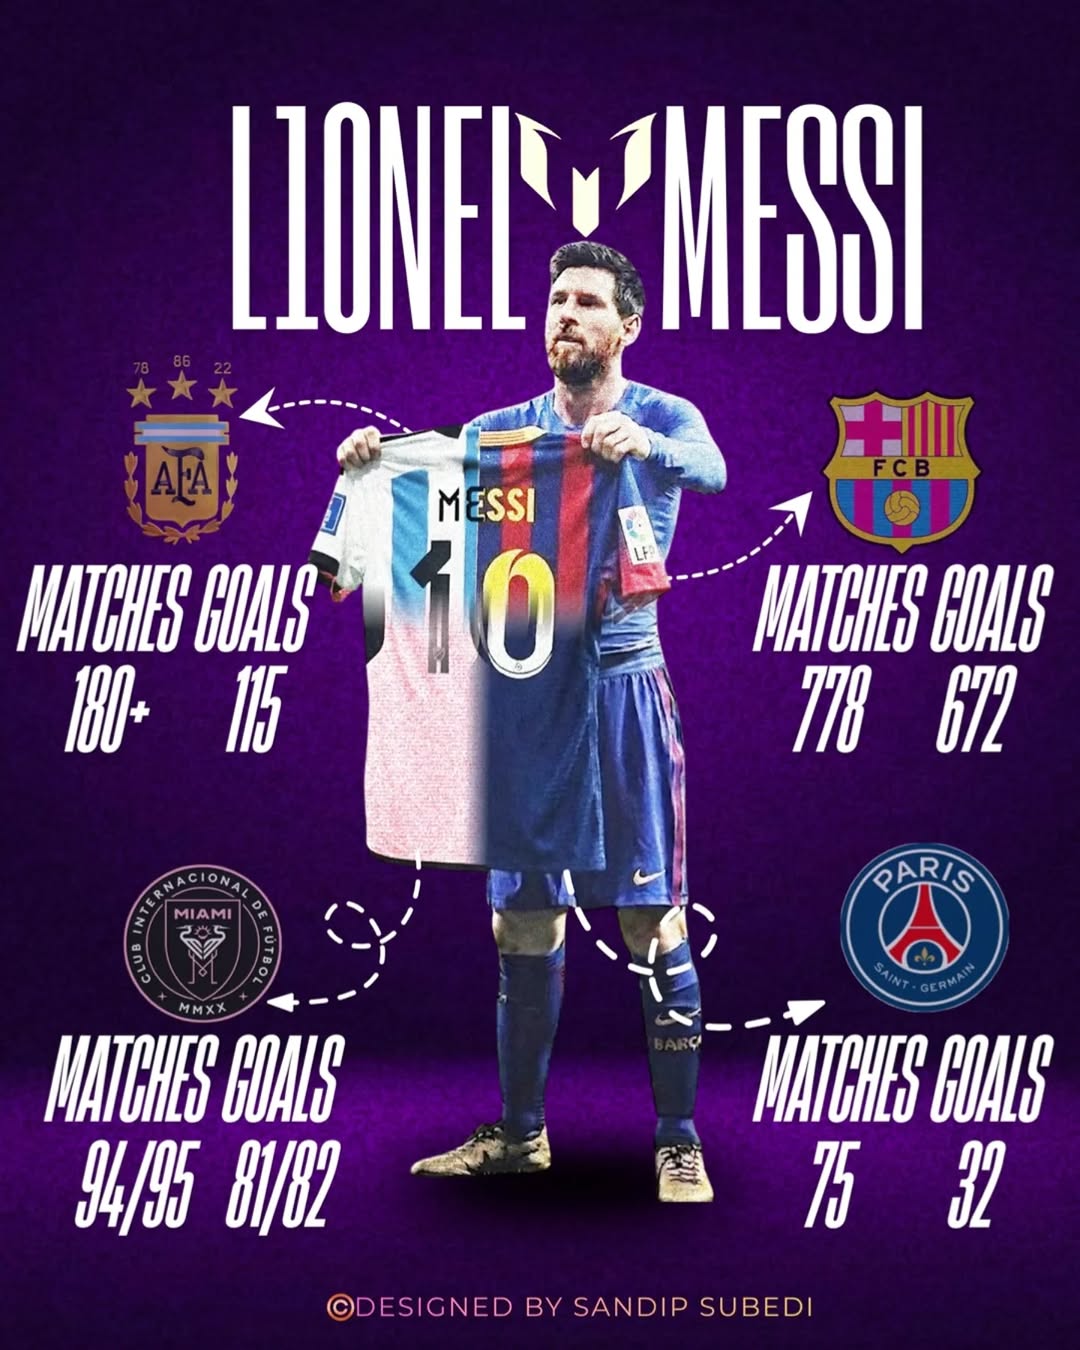
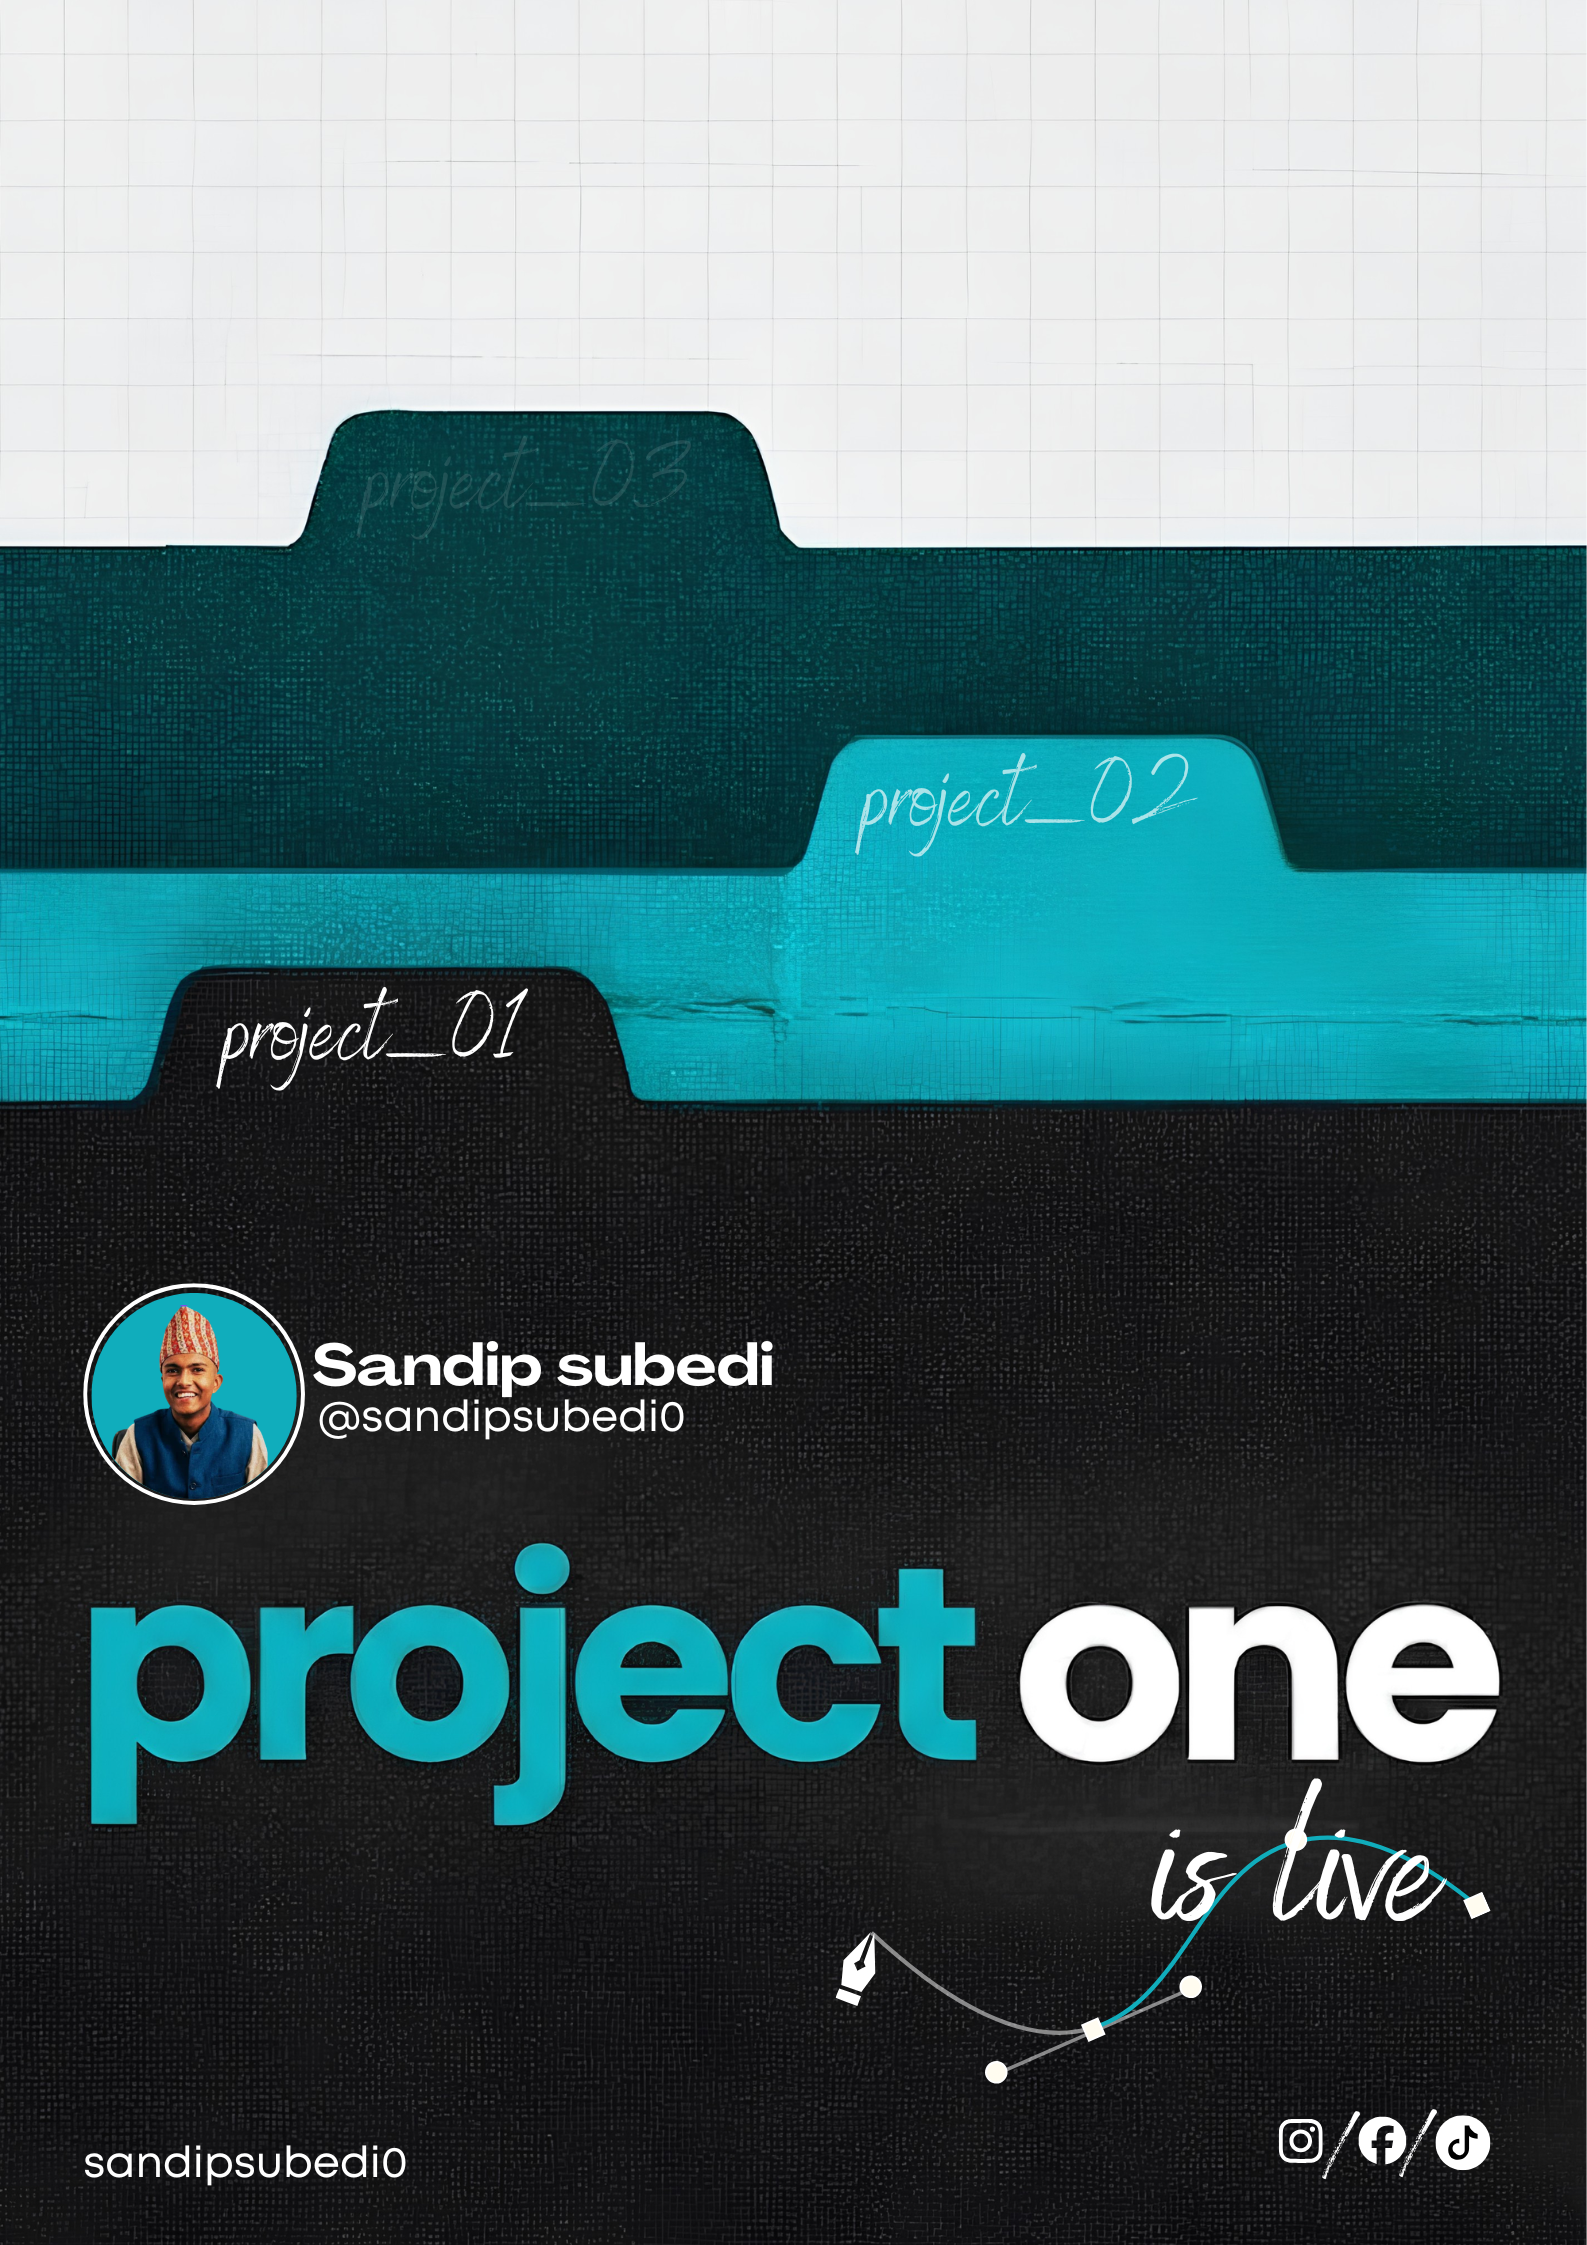
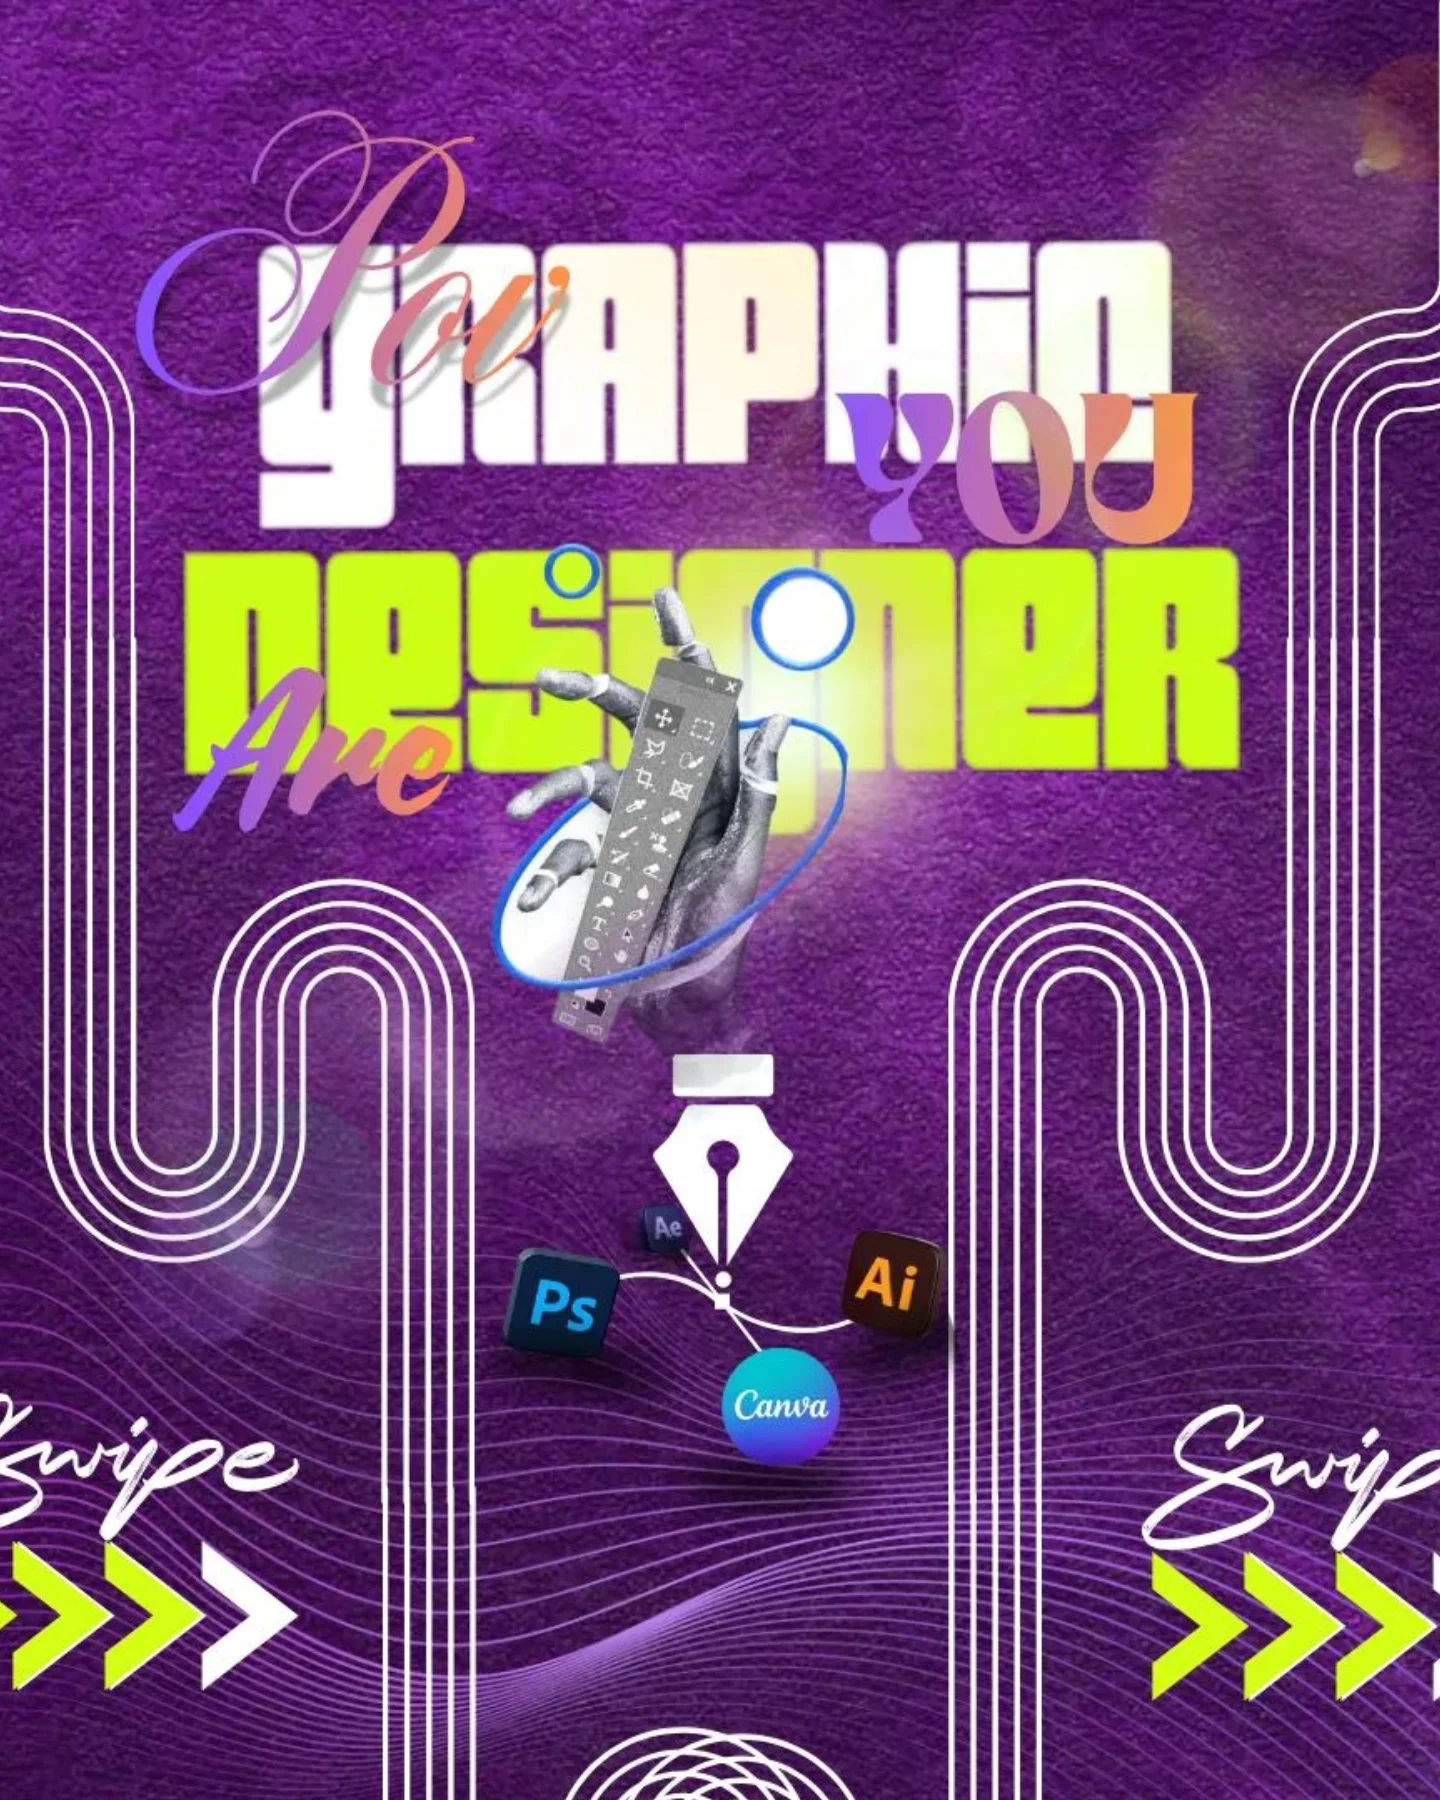
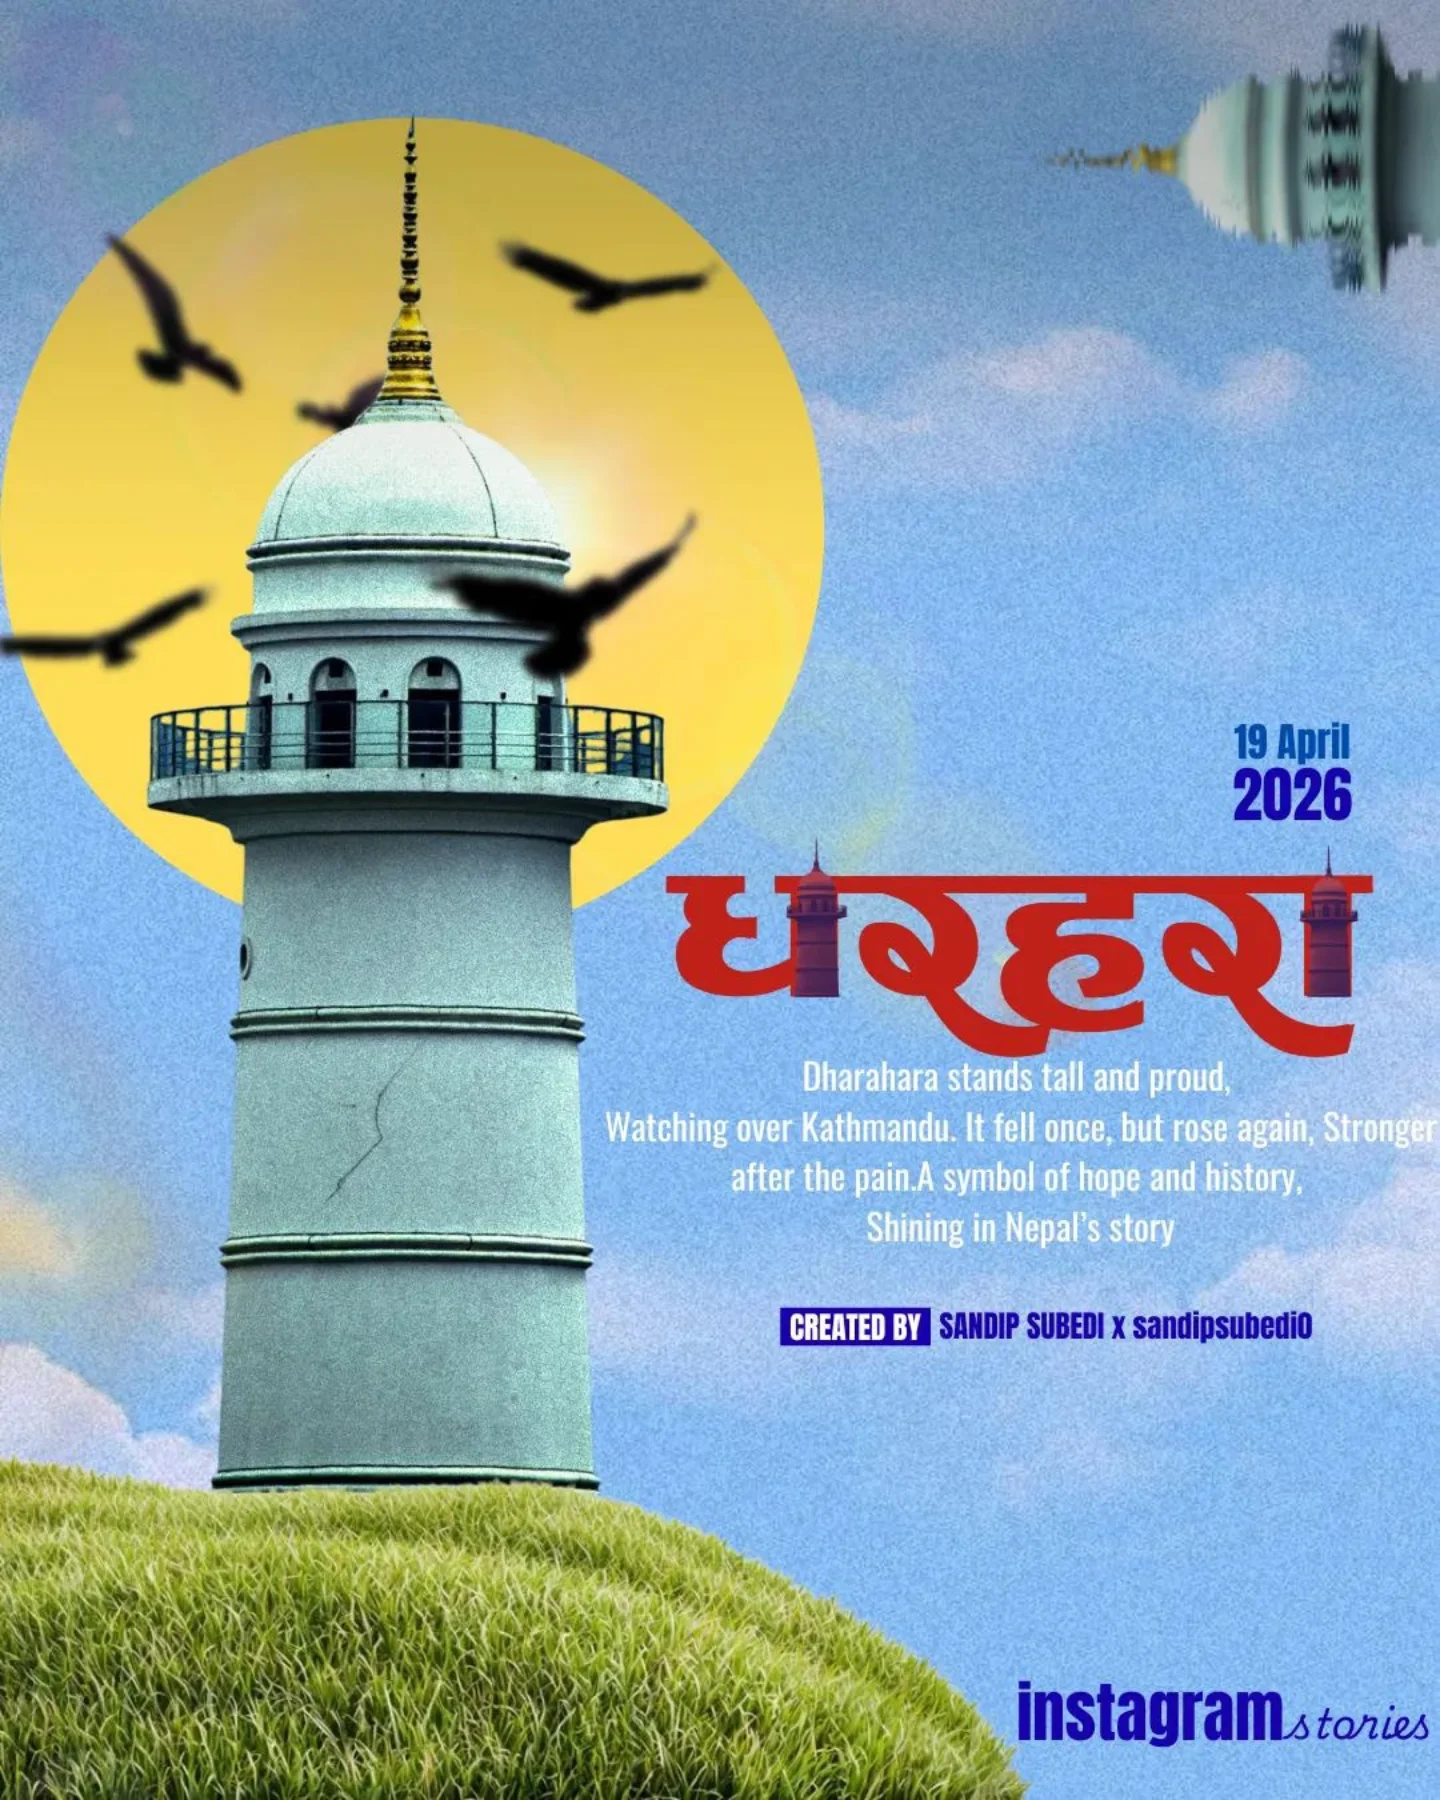
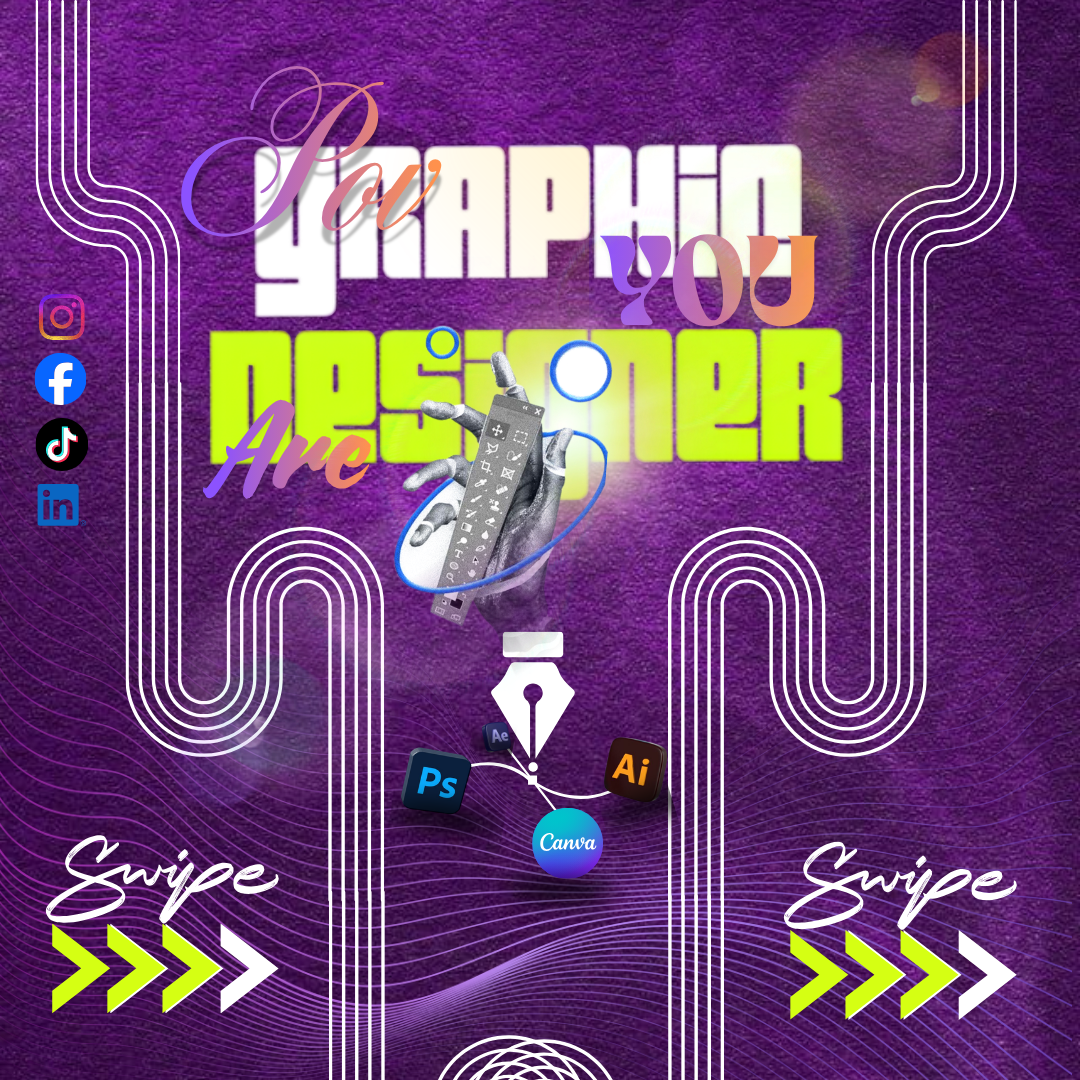
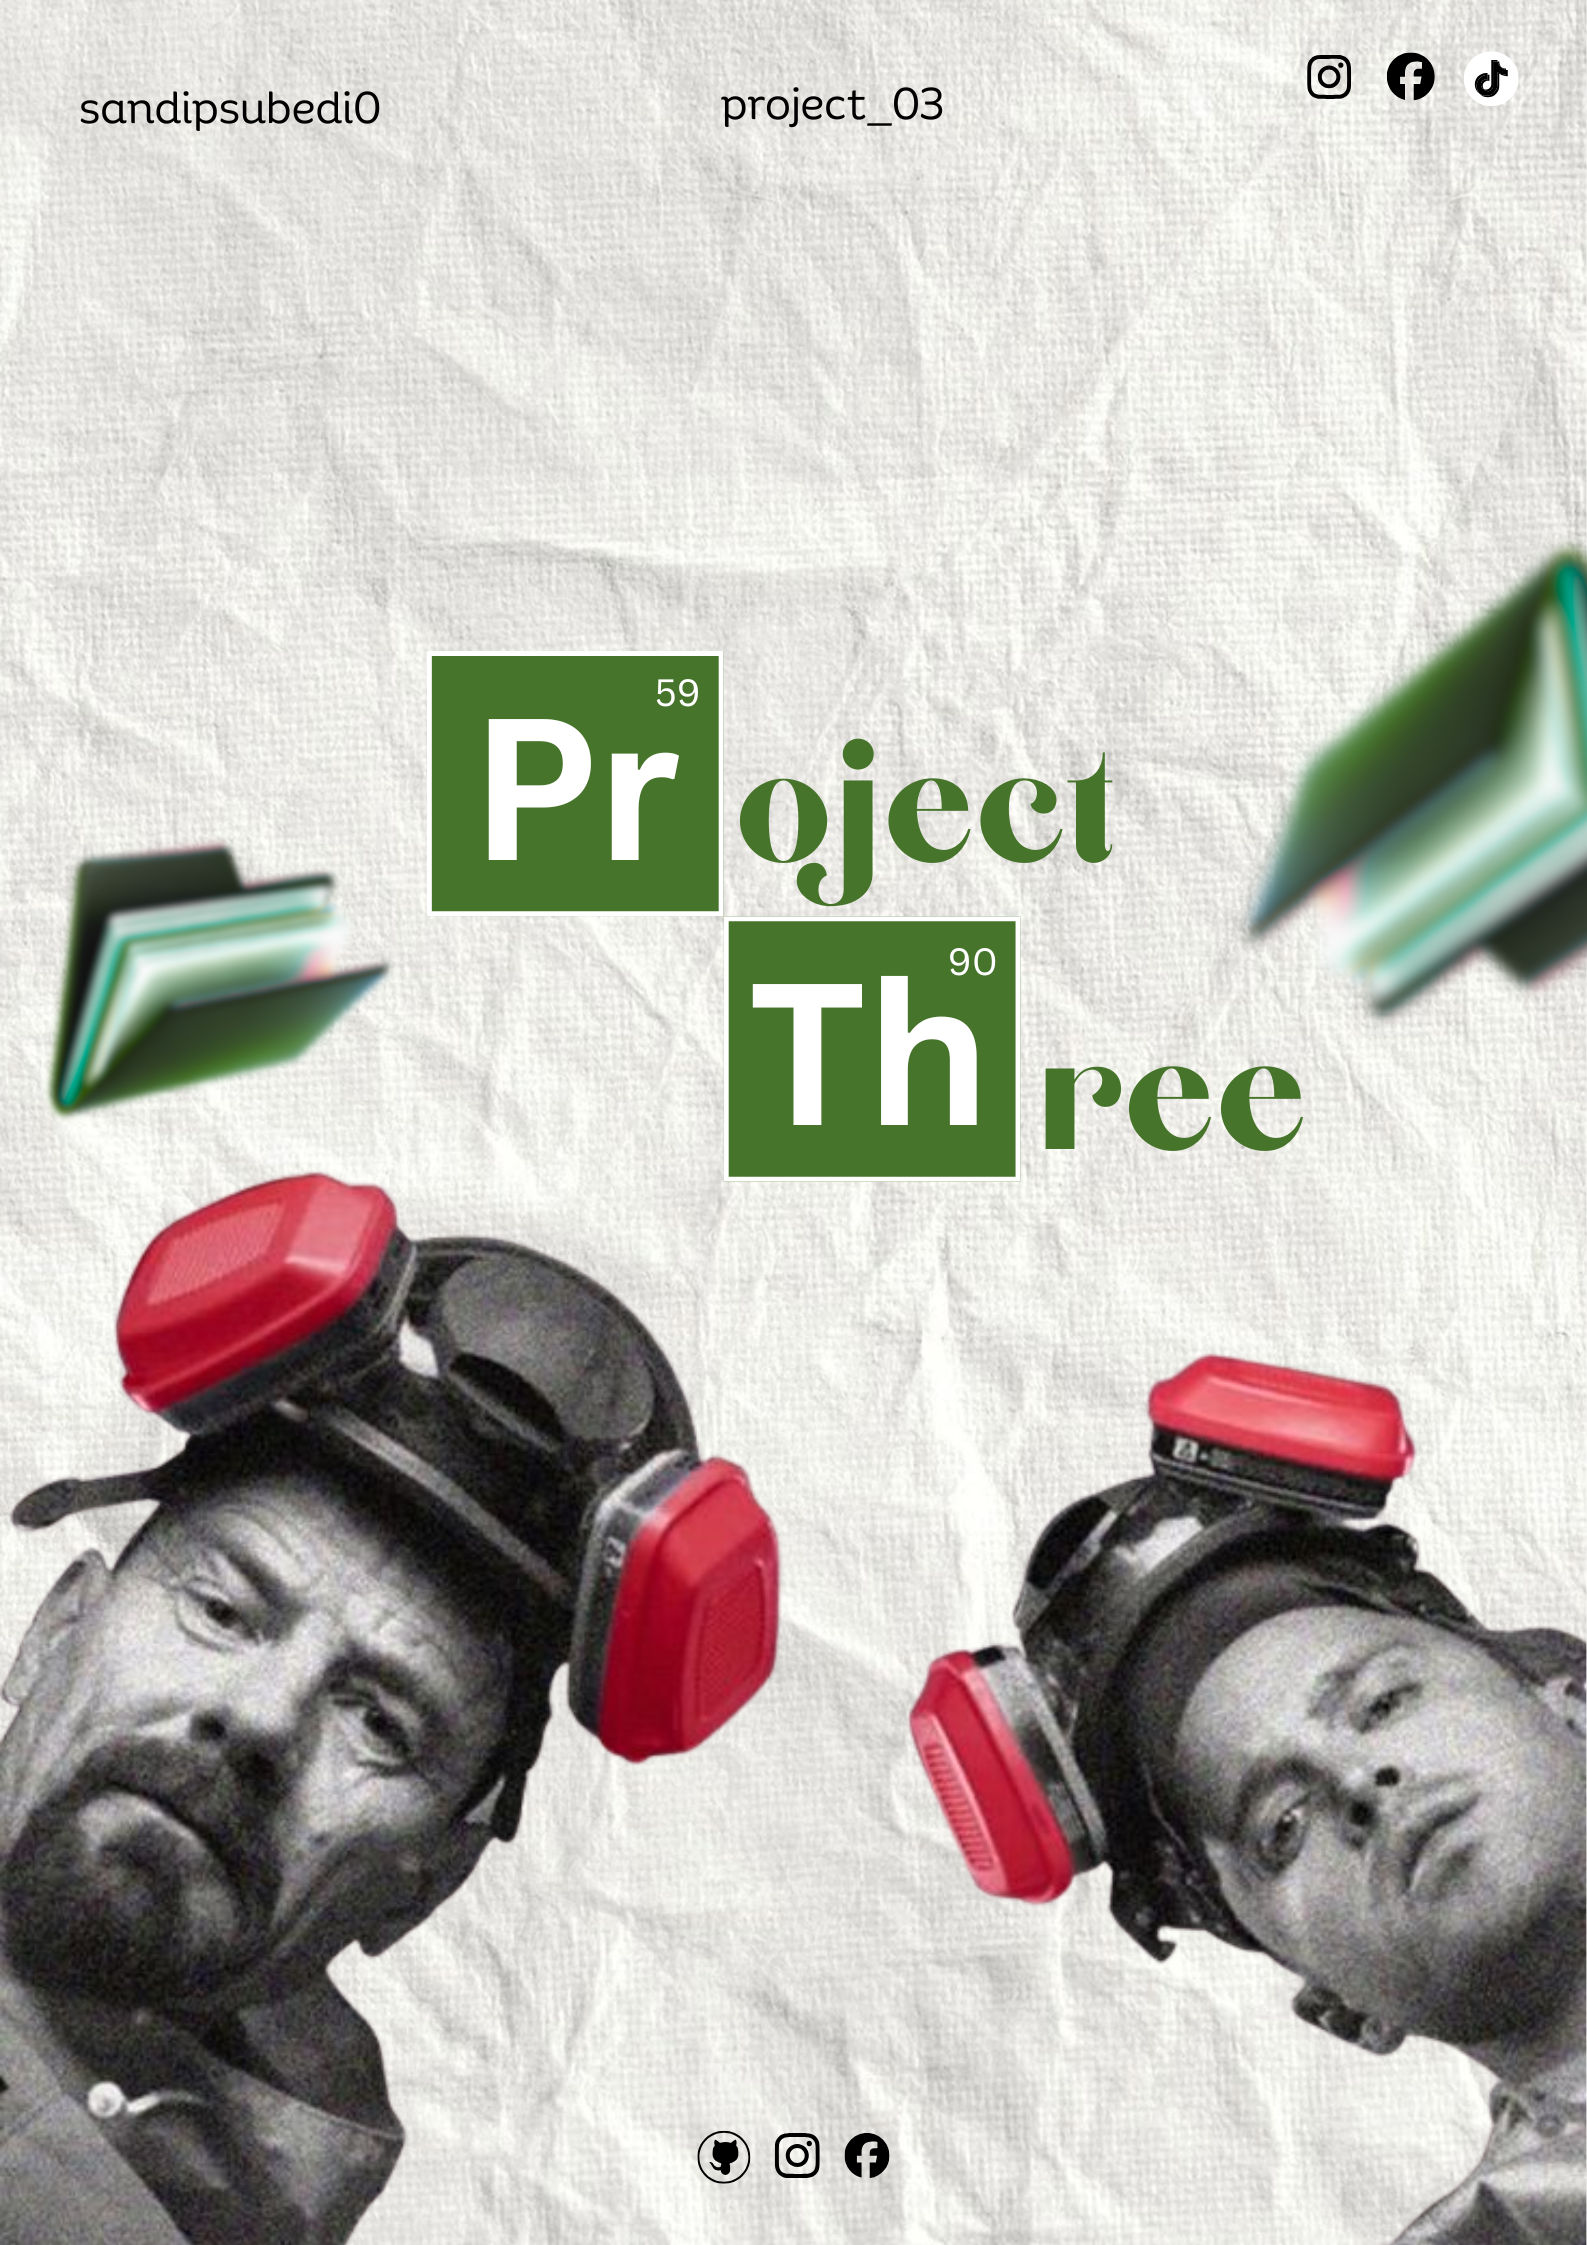
Posters, brand assets, and social creatives made for real clients — 2.5+ years in Canva and Photoshop.

Poster design 01
Poster design 02
Poster design 03
Poster design 04
Poster design 05
Poster design 06
Poster design 07
Poster design 08
Poster design 05
Poster design 06
Poster design 07
Poster design 08
Poster design 01
Poster design 02
Poster design 03
Poster design 04

From the blog.

Writing up each project as it's built — Python fundamentals, ML notebooks, and RAG pipelines — over on Hashnode.

Teaching a Webcam to See — YOLOv8 object detection
Jul 16, 20265 min read

Teaching a Webcam to See: Building a Real-Time Object Detection Pipeline with YOLOv8

Semantic FAQ Bot project cover
Jul 3, 20265 min read

I Built a Semantic FAQ Bot That Understands Meaning Instead of Keywords — Project #4

BMW 14-year sales data analysis cover
Jun 10, 20266 min read

I Analyzed 14 Years of BMW Sales Data — Here's What I Found

Titanic survival analysis cover
Jun 8, 20269 min read

Titanic Survival Analysis — What the Data Reveals About Who Lived and Who Died

HR data analysis project cover
Jun 3, 20262 min read

From Raw Data to Real Insights — My First HR Data Analysis Project

{ } 01 10 11
Jan 18, 20263 min read

How Python Code Really Runs: Understanding Bytecode and The Python Virtual Machine

Read all posts on Hashnode →
Let's talk

Ready to turn your
data into a decision.

Open to Data Analyst internships and collaborations in Kathmandu and remote — reach out any time.